Troubleshooting Functions
If a function is not behaving as expected, you can look at the logs to troubleshoot. You can either perform this operation remotely by copying the /root/.kube/config onto your local desktop and you can interact with VEBA using your local kubectl client or ssh to the appliance using the local kubectl client.
List out the pods within the vmware-functions namespace.
kubectl -n vmware-functions get pods
This is an example output:
default-broker-ingress-78b9f88599-2vwwn           1/1     Running   1 (2d ago)   4d13h
kn-pcli-tag-00001-deployment-6d6db78495-bdz8j     2/2     Running   0            8m8s
sockeye-79b7fc7c55-klcnh                          1/1     Running   1 (2d ago)   4d13h
sockeye-trigger-dispatcher-84cf59c5d9-wdfqj       1/1     Running   1 (2d ago)   4d13h
vcsa-source-adapter-9984f787-h7bth                1/1     Running   0            18h
veba-pcli-tag-trigger-dispatcher-796895df-4fx2c   1/1     Running   0            6m57s
First, we want to see if the event-viewer application Sockeye is receiving events from the configured VSphereSource.
Use this command to follow the logs.
kubectl logs -n vmware-functions deployment/sockeye -f
You should continuously see event payloads on your terminal.
The same can be done by browsing the VEBA events endpoint https://[veba-fqdn]/events.
For this sample troubleshooting, we have the sample PowerCLI Tagging function running which will react to a VM powered on Event com.vmware.vsphere.DrsVmPoweredOnEvent.v0. To see if the appliance is properly handling the event, create a test VM and power it on before proceeding with the next steps.
When we look at the log output, we should see an entry similar to the following:
Context Attributes,
  specversion: 1.0
  type: com.vmware.vsphere.DrsVmPoweredOnEvent.v0
  source: https://vcsa.jarvis.lab/sdk
  id: 280034
  time: 2024-01-17T13:02:05.426999Z
  datacontenttype: application/json
Extensions,
  eventclass: event
  vsphereapiversion: 8.0.2.0
Data,
  {
    "Key": 280034,
    "ChainId": 280032,
    "CreatedTime": "2024-01-17T13:02:05.426999Z",
    "UserName": "VSPHERE.LOCAL\\Administrator",
    "Datacenter": {
      "Name": "jarvis-lab",
      "Datacenter": {
        "Type": "Datacenter",
        "Value": "datacenter-1001"
      }
    },
    "ComputeResource": {
      "Name": "mk-1",
      "ComputeResource": {
        "Type": "ClusterComputeResource",
        "Value": "domain-c1015"
      }
    },
    "Host": {
      "Name": "esxi02.jarvis.lab",
      "Host": {
        "Type": "HostSystem",
        "Value": "host-1012"
      }
    },
    "Vm": {
      "Name": "workload1",
      "Vm": {
        "Type": "VirtualMachine",
        "Value": "vm-2073"
      }
    },
    "Ds": null,
    "Net": null,
    "Dvs": null,
    "FullFormattedMessage": "DRS powered on workload1 on esxi02.jarvis.lab in jarvis-lab",
    "ChangeTag": "",
    "Template": false
  }
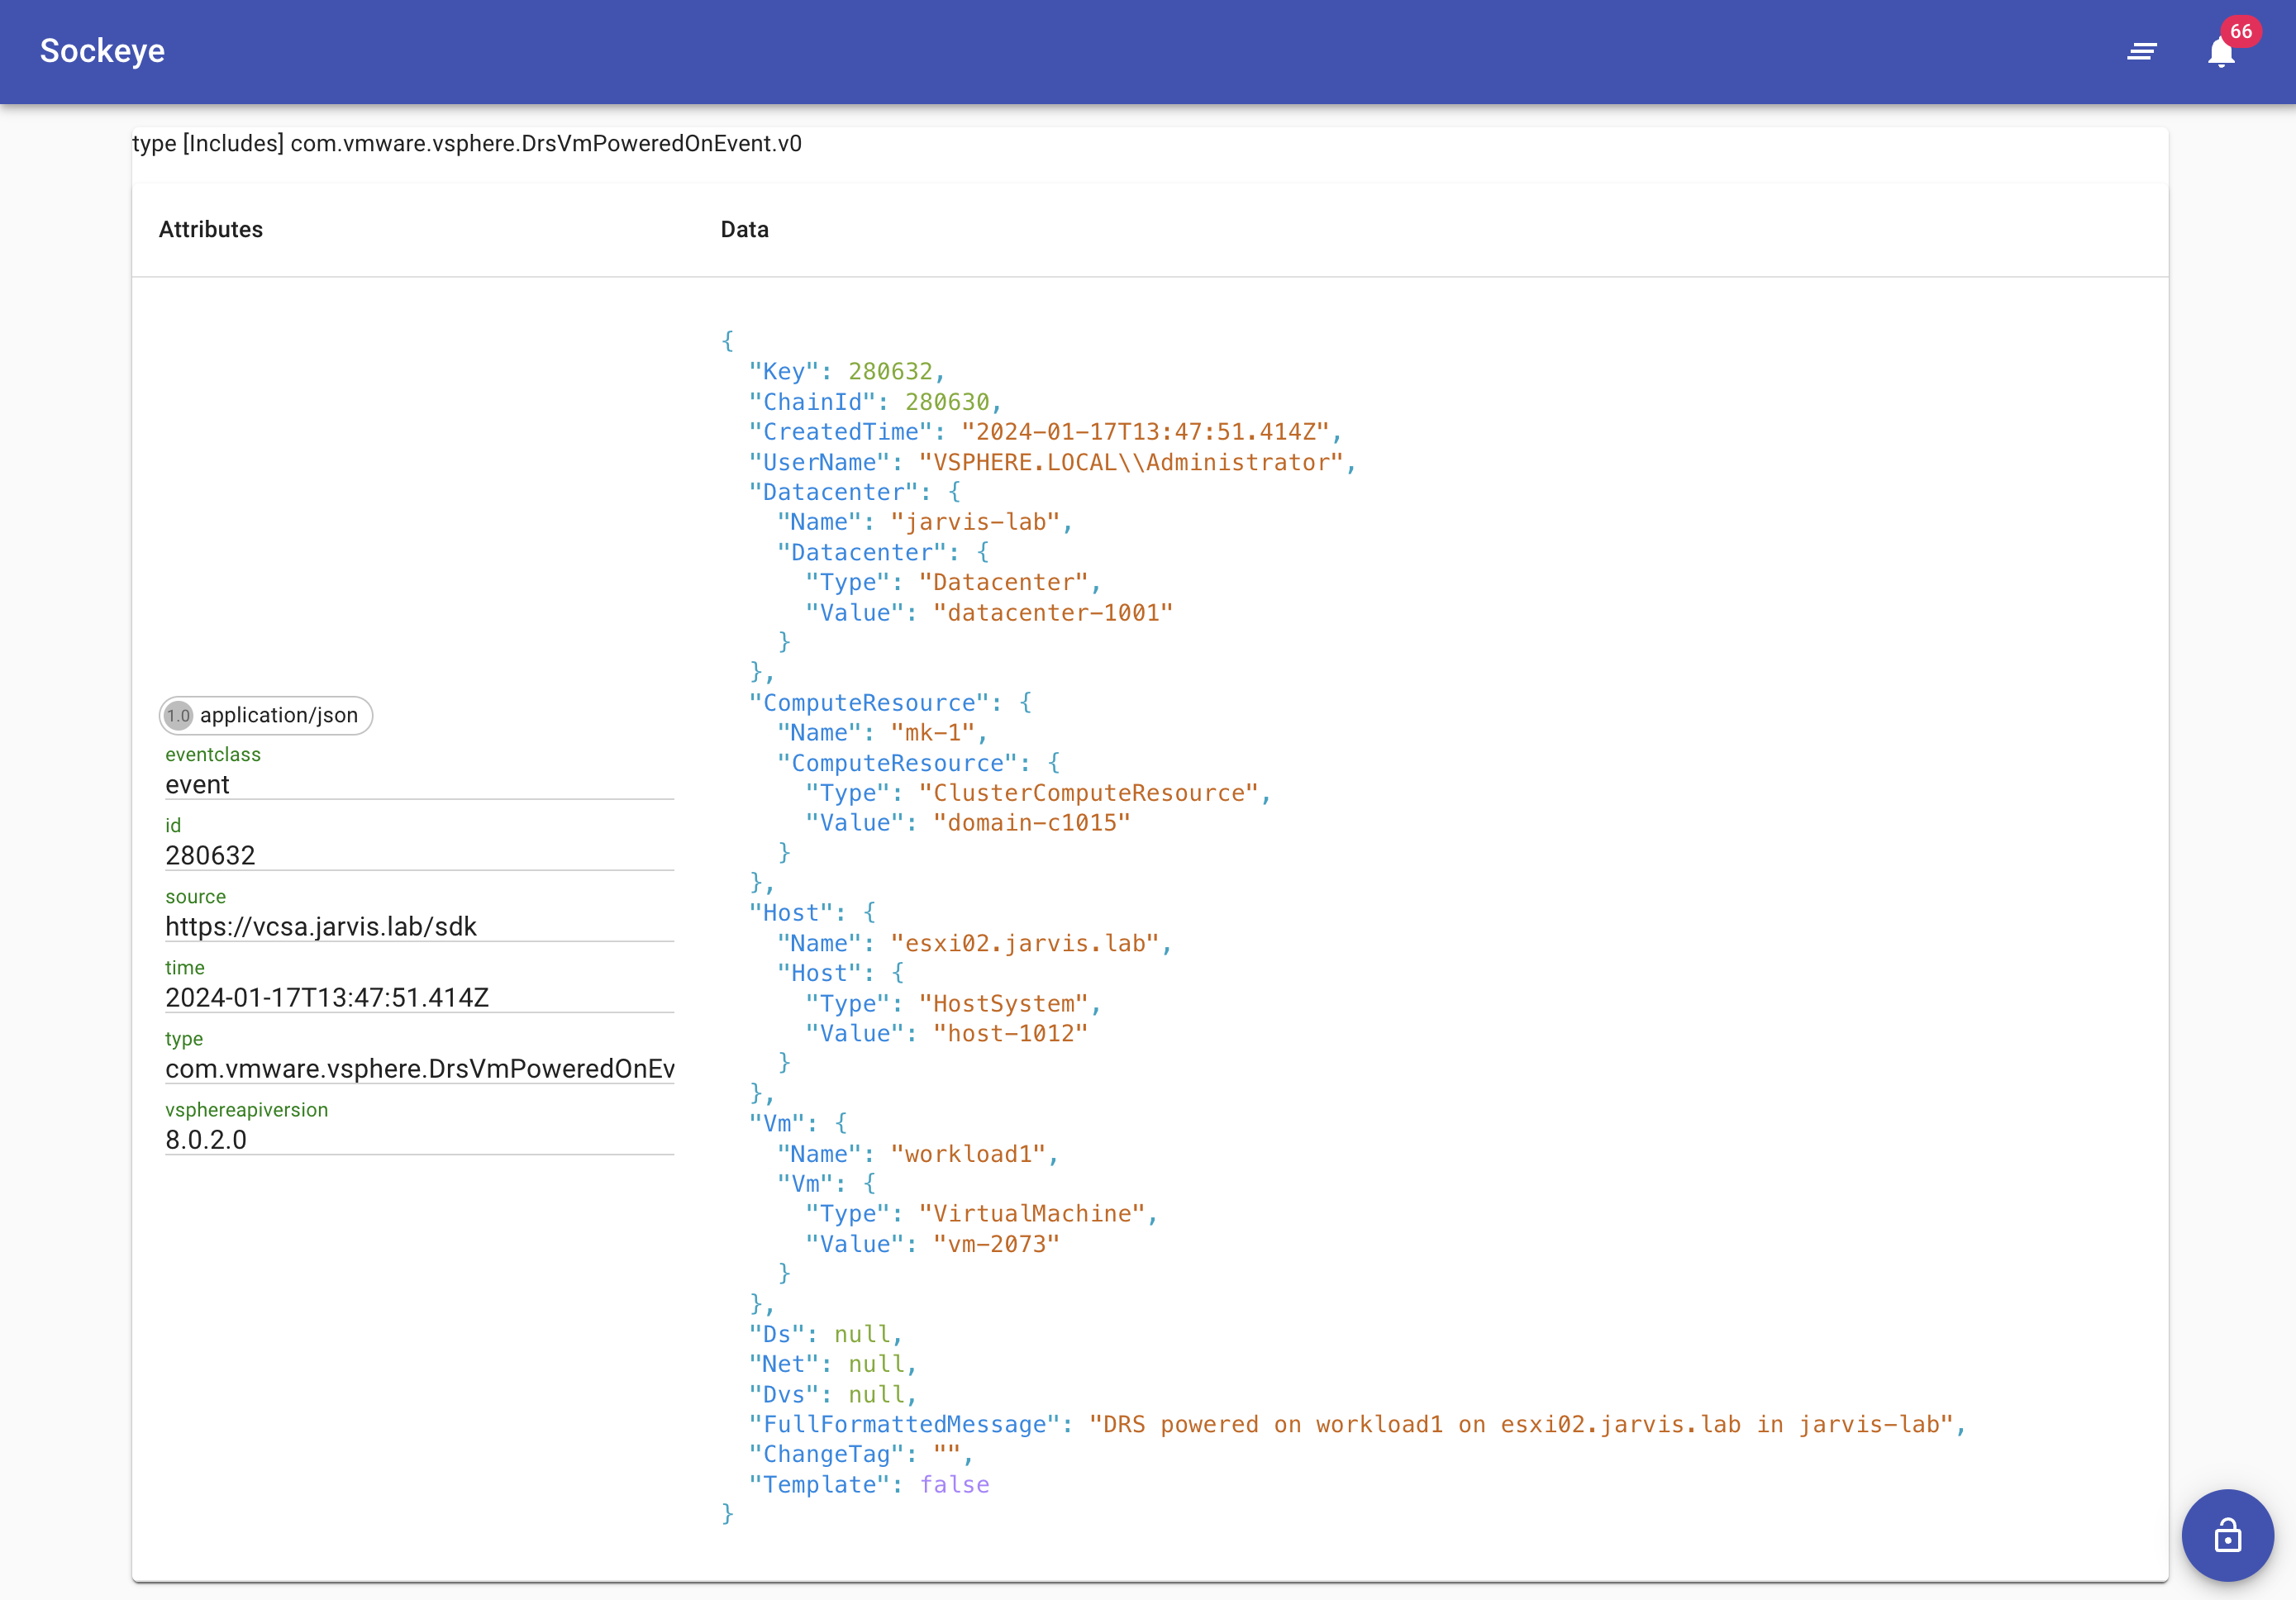
Similar in Sockeye:

Each Knative function will have its own pod running in the vmware-functions namespace. If you have deployed the provided tagging function example from the VEBA function examples, you can examine the logs with the following command:
kubectl logs -n vmware-functions deployment/kn-pcli-tag-00001-deployment user-container
Note: Replace the name of the deployment in the examples with the name within your environment.
First indications of a working function can be obtained directly after deploying a function. For example if a function is successfully connected to a system. The Tagging function for example establishes a connection to the specified vCenter Server system. Here’s a log output sample:
kubectl -n vmware-functions logs kn-pcli-tag-00001-deployment-6d6db78495-bdz8j

Defaulted container "user-container" out of: user-container, queue-proxy
01/17/2024 10:34:57 - PowerShell HTTP server start listening on 'http://*:8080/'
01/17/2024 10:34:57 - Processing Init

01/17/2024 10:34:57 - Configuring PowerCLI Configuration Settings


DefaultVIServerMode         : Multiple
ProxyPolicy                 : UseSystemProxy
ParticipateInCEIP           : True
CEIPDataTransferProxyPolicy : UseSystemProxy
DisplayDeprecationWarnings  : True
InvalidCertificateAction    : Ignore
WebOperationTimeoutSeconds  : 300
VMConsoleWindowBrowser      :
Scope                       : Session
PythonPath                  : /usr/local/bin/python3

DefaultVIServerMode         :
ProxyPolicy                 :
ParticipateInCEIP           : True
CEIPDataTransferProxyPolicy :
DisplayDeprecationWarnings  :
InvalidCertificateAction    : Ignore
WebOperationTimeoutSeconds  :
VMConsoleWindowBrowser      :
Scope                       : User
PythonPath                  :

DefaultVIServerMode         :
ProxyPolicy                 :
ParticipateInCEIP           :
CEIPDataTransferProxyPolicy :
DisplayDeprecationWarnings  :
InvalidCertificateAction    :
WebOperationTimeoutSeconds  :
VMConsoleWindowBrowser      :
Scope                       : AllUsers
PythonPath                  : /usr/local/bin/python3

01/17/2024 10:35:02 - Connecting to vCenter Server vcsa.jarvis.lab

IsConnected   : True
Id            : /VIServer=vsphere.local\administrator@vcsa.jarvis.lab:443/
ServiceUri    : https://vcsa.jarvis.lab/sdk
SessionSecret : "a58cfe1ebd168aff2345ab80c0a1343ae4414c3d"
Name          : vcsa.jarvis.lab
Port          : 443
SessionId     : "a58cfe1ebd168aff2345ab80c0a1343ae4414c3d"
User          : VSPHERE.LOCAL\Administrator
Uid           : /VIServer=vsphere.local\administrator@vcsa.jarvis.lab:443/
Version       : 8.0.2
Build         : 22617221
ProductLine   : vpx
InstanceUuid  : 60b82abd-ba3b-4114-825b-d48c1bdd5dea
RefCount      : 1
ExtensionData : VMware.Vim.ServiceInstance

01/17/2024 10:35:07 - Successfully connected to vcsa.jarvis.lab

01/17/2024 10:35:07 - Init Processing Completed

01/17/2024 10:35:07 - Starting HTTP CloudEvent listener
If a function got correctly invoked can be seen via the logs as well after the specified event occured.
This command will show you the last 5 minutes worth of logs.
kubectl -n vmware-functions logs deployment/kn-pcli-tag-00001-deployment user-container --since=5m
This command will show you the last 20 lines of logs.
kubectl -n vmware-functions logs deployment/kn-pcli-tag-00001-deployment user-container --tail=20
Log output showing a successful function invocation:
01/17/2024 10:37:41 - Applying vSphere Tag "backup-sla" to workload1 ...

01/17/2024 10:37:51 - vSphere Tag Operation complete ...

01/17/2024 10:37:51 - Handler Processing Completed ...
Still having trouble?
Please submit bug reports and feature requests by using our GitHub Issues page.
